
- Retrait gratuit dans votre magasin Club
- 7.000.000 titres dans notre catalogue
- Payer en toute sécurité
- Toujours un magasin près de chez vous
- Retrait gratuit dans votre magasin Club
- 7.000.0000 titres dans notre catalogue
- Payer en toute sécurité
- Toujours un magasin près de chez vous


Description
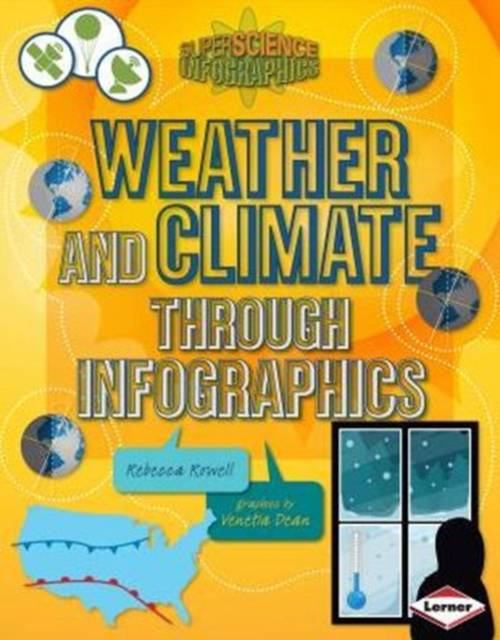
Trying to breeze through weather and climate facts just might cause a brain freeze! You're showered with details about extreme temperatures (Earth's record high is 134°F and record low is -129°F), crazy heights (our atmosphere extends 6,200 miles above Earth), and even huger mysteries (how predictions in weather and climate work).
How can all these big numbers and concepts make more sense? Infographics! The charts, maps, and illustrations in this book tell a visual story to help you better understand key concepts about weather and climate. Crack open this book to explore mind-boggling questions such as:
- How do cold and warm fronts change weather?
- How can cities at similar latitudes have significantly different climates?
- How do ocean currents help create winds, temperature changes, and storms?
The answers are sure to blow you away!
Spécifications
Parties prenantes
- Auteur(s) :
- Editeur:
Contenu
- Nombre de pages :
- 32
- Langue:
- Anglais
- Collection :
Caractéristiques
- EAN:
- 9781467715959
- Date de parution :
- 01-08-13
- Format:
- Livre broché
- Format numérique:
- Trade paperback (VS)
- Dimensions :
- 165 mm x 224 mm
- Poids :
- 77 g

Les avis
Nous publions uniquement les avis qui respectent les conditions requises. Consultez nos conditions pour les avis.